Improving brain models with ZAPBench
April 24, 2025
Jan-Matthis Lückmann and Michał Januszewski, Research Scientists, Google Research
In collaboration with HHMI Janelia & Harvard, we introduce ZAPBench, a whole-brain activity dataset and benchmark with single cell resolution on the larval zebrafish to enable the development and comparison of more accurate brain activity models.
Quick links
Inside every brain lies a staggering number of neurons, firing complex patterns of electrical impulses through a vast and intricate network of synapses. Understanding these patterns is key to understanding how they generate complex behavior. The pursuit of connectomics — comprehensively mapping all the neural connections in the brain — offers a powerful approach to this problem.
Google has made fundamental contributions to connectomics over the past decade, creating maps in several species, including humans. But these structural maps can only take us so far. They tell us how cells are connected, but to understand how these connections are used, we need data capturing the dynamic activity of neurons over time. While researchers have previously recorded large-scale brain activity and developed models from these observations, such efforts have never simultaneously mapped the detailed structural connectome and recorded functional activity across a significant fraction of the same brain.
To bridge that limitation, together with our collaborators at HHMI Janelia and Harvard University, we acquired a whole-brain dataset of a larval zebrafish brain. This dataset features recordings of roughly 70,000 neurons, and we are in the process of generating a comprehensive connectome for the specimen for which the activity data was recorded. This unique combination will, for the first time, allow us to directly investigate the relationship between the precise structural wiring and the dynamic patterns of neural activity across an entire vertebrate brain.
In this post, we describe the whole-brain activity dataset and the Zebrafish Activity Prediction Benchmark, ZAPBench, which we announce this week at ICLR 2025. With the ZAPBench open-source dataset, researchers have detailed recordings that they can use to build models of brain activity, and using the benchmark, they can quantify the accuracy of predictive models.
Benchmarking brain models
The advent of data-driven benchmarks, allowing for evaluation and comparison of machine learning (ML) models, have driven tremendous advances across domains. Just like ML benchmarks have driven progress in weather forecasting, computer vision, and language modeling, they are now giving a boost to the field of neuroscience. Existing efforts like the Dynamic Sensorium Competition, which improved our understanding of how the mouse visual cortex processes visual stimuli, only cover a small fraction of the brain they studied (less than 0.1%). ZAPBench is unique in that it covers nearly the entire brain of a small vertebrate.
Whole-brain activity in a small vertebrate
Traditionally, neuroscientists study neural activity by breaking complex behaviors into smaller parts. To study hunting, for example, they might look at the hunger-sensing capabilities of the cells and organs, the olfactory system that allows an animal to smell their prey, the visual system for tracking, and so on. But complex behaviors almost always involve multiple areas simultaneously, including sensation, decision-making, memory, and movement. To make it even more complicated, neural processing is distributed throughout the brain.
ZAPBench takes a unique approach that focuses on the activity in a vertebrate’s entire brain. Leveraging pioneering work on whole-brain activity recording from our collaborators at Janelia, we built our dataset and benchmark with images captured from the entire brain of the larval zebrafish. We chose the larval zebrafish for several reasons. At only six days old, it is capable of complex tasks that involve motor learning and memory, such as adjusting to moving currents and light conditions, stalking and hunting small prey, and remembering dangerous environments. Furthermore, and most importantly, it is small and transparent, and its entire brain can be imaged under a specialized microscope.
To gather data for our benchmark, our collaborators Alex Chen and Misha Ahrens at HHMI Janelia recorded the fish’s brain activity under a specialized light sheet microscope that uses a laser beam to scan the brain one thin slice at a time and generates a 3D image. The fish was engineered to express GCaMP, a genetically encoded calcium indicator that flashes bright green when it binds to calcium ions that enter active neurons. In order to get a clear image of these proteins as they lit up, the fish was immobilized in a jelly-like substance. To measure its brain’s response to different stimuli, computer generated images were projected around the fish, while the scanning microscope recorded brain activity. A total of two hours of brain activity was recorded in 3D.

Larval zebrafish are immobilized in a jelly-like substance while a light sheet microscope records brain activity in response to virtual reality-generated stimuli. Image credit: Igor Siwanowicz.
The fish was exposed to nine different types of visual stimuli using a virtual reality setup that modeled simplified versions of conditions that the fish could encounter in its natural environment. Examples included changing water current directions, alternating light and darkness, and powerful currents that sweep the fish away. For example, our collaborators measured how the fish might adjust their swimming to shifting water currents by projecting moving lines across the bottom of the tank. Zebrafish swim in shallow rivers and the lines were meant to mimic how waves cast shadows on the sandy bottom. The fish was fitted with electrodes in its tail to record muscle activity and filmed from above: When the lines started moving, the fish attempted to swim against the virtual current.
Calcium imaging captures activity throughout the entire volume of the brain.
Once the imaging experiments were completed, the raw data were corrected for motion artifacts. We used two separate data types to compare their effectiveness for training our models. One was a 3D volumetric video of light-sheet microscope data. In the second, we processed the video data to show the activity of each individual neuron over time, called a time-series. Like a very long movie reel where each line shows the activity of a single brain cell over two hours, the time series data is used to isolate individual neurons. In order to separate out the neurons from the 3D video, we used voxel-level segmentation to identify which activity trace belongs to which neuron. This process identifies the boundaries of each neuron at the smallest 3D unit, a voxel (3D pixel).

Voxel-level segmentation visualizing individual neuron cell bodies, which were used to extract activity traces of each of the 71,721 neurons.
We then mapped the neurons’ activity over time in response to the various virtual reality animations shown to the fish. In the figure below, we display the activity map of the neurons measured in the zebrafish’s brain. The brightness of the line at any point reflects how "active" that cell was at that moment. Vertical lines mark when the animation being shown to the fish changed. The neuron traces are arranged so cells with similar "stories" are close together. However, the image is stretched out horizontally to make it easier to see the activity changes over time for each cell.

The activity of 71,721 neurons were mapped to a time series in response to various visual stimuli. For example, “Gain” refers to a current being simulated in the fish’s environment. The brightness of the lines correspond to how active the neurons were at that moment.
Evaluating predictive performance
Much like large language models can predict future words in a sentence, we aim to develop brain models that can predict neural firing patterns. With ZAPBench, we ask the following question: Given a clip of recorded brain activity, how accurately can a model predict the subsequent 30 seconds of activity? To kick off the benchmarking process, we built models based on both types of data (time-series and 3D volumetric) and also created naïve baselines, for example, based on averaging the activity of each neuron over time (an overly simplistic approach). We examined the two data sources to determine the trade-offs between them. Time trace data requires more post-processing and contains less information than a volumetric image, but it is easier to work with due to the small size of the data and lower computational cost.

Side by side comparison of a brain activity map. Left: Ground truth. Right: Prediction.
We tested a range of models on their ability to predict brain activity and scored them using the mean absolute error (MAE) metric, which measures the difference between the predicted activity and actual activity. We learned several things. First, models trained with more context data (longer video clips) perform significantly better than those based on short context data (shorter videos), making fewer mistakes when compared to the ground truth.
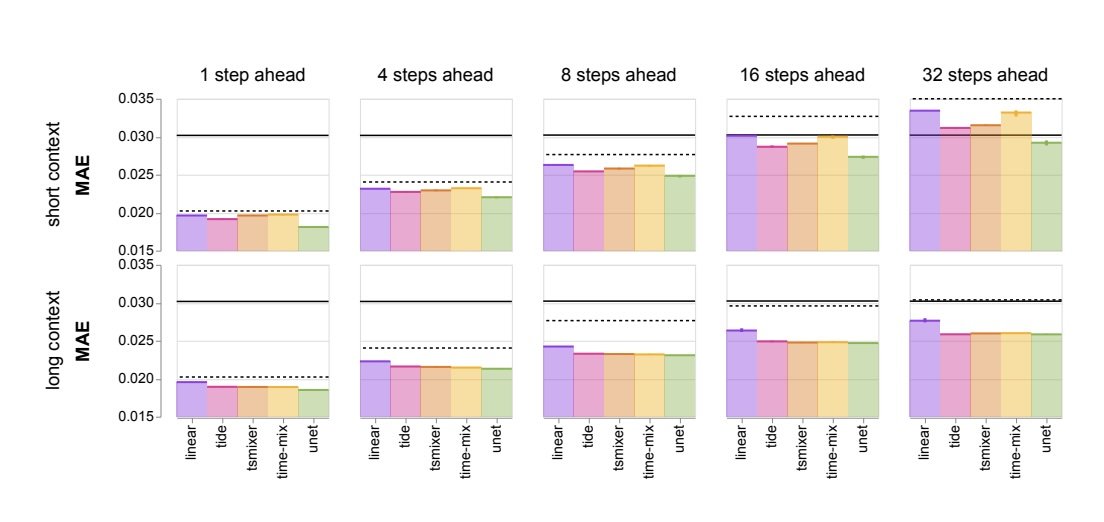
The mean absolute error (MAE) is lower for long context versus short context across all nine environmental stimuli conditions (lower is better). The black lines (solid & dashed) are the naïve baselines (see paper for details).
Second, volumetric training (on the 3D video) out-performed the time-series models in some instances, which we suspect is thanks to the 3D models having access to the spatial relationships between cells. Also, interestingly, when the models make mistakes they tend to happen more frequently in specific areas of the brain, meaning some brain areas are harder to predict than others. We also saw that video models worked well with lower resolution data. These observations raise interesting research questions to be explored in the future.
Future work
We are working with our collaborators at HHMI Janelia to complete a whole-brain connectome for the larval zebrafish that will extend the ZAPBench dataset with information about physical connectivity. In the future, this will make it possible to build more biologically grounded models and hopefully enhance forecasting accuracy.
Acknowledgements
We thank our academic collaborators at HHMI Janelia and in the Lichtman and Engert labs at Harvard, and we acknowledge core contributions from the Connectomics Team at Google. We are grateful to Monique Brouillette and Elise Kleeman for their help in writing this blog post. Thanks to Lizzie Dorfman, Michael Brenner, John Platt, and Yossi Matias for their support, coordination and leadership.
-
Labels:
- General Science
- Health & Bioscience
Quick links
Other posts of interest
-

April 23, 2025
Introducing Mobility AI: Advancing urban transportation- Algorithms & Theory ·
- General Science ·
- Machine Intelligence
-

April 17, 2025
Teaching machines the language of biology: Scaling large language models for next-generation single-cell analysis- Health & Bioscience ·
- Natural Language Processing
-

April 3, 2025
Evaluating progress of LLMs on scientific problem-solving- General Science ·
- Generative AI ·
- Natural Language Processing