Competitive benchmarking
Knowing which of your competitors are faster than you is a great way to get performance buy-in throughout your organization.
With SpeedCurve Synthetic, you can monitor any other website in the same way that you can your own website. That means you get all that same, rich, awesome data, screenshots, and filmstrips that you can compare.
You can also drill down and focus in on things like construction. That website that's rendering twice as fast as yours... what are they doing differently? Have they got more Java script? Have they got less? Are you making 400 requests and they're only making 80? This is the place to find that out.
Here's a competitive benchmarking demo using LEGO.com
SpeedCurve already tracks leading sites across several industries. Let's add LEGO.com to the list.
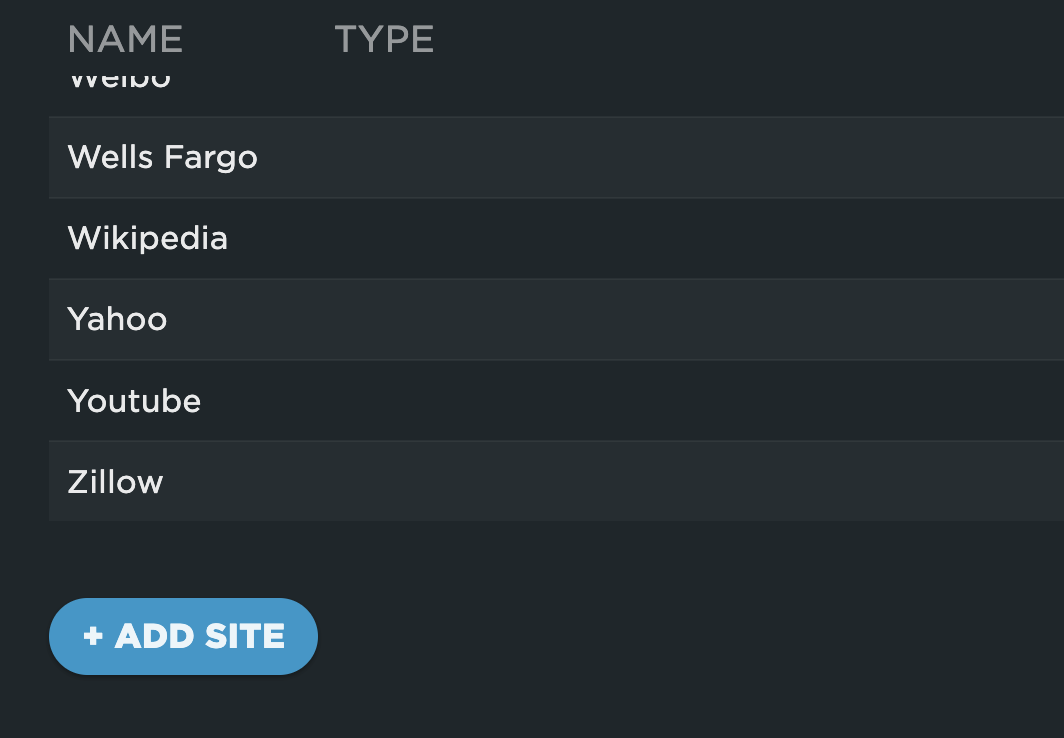
On the Settings page, first we click the Add Site button.
We give the home page the custom label Home. To compare the performance of more pages, let's add more individual URLs and give them unique labels, such as PDP for product detail pages or Search for search pages.

Now we can hit the Save button to add these URLs to the competitive benchmarks. The URLs will be tested during your next scheduled test run. Alternatively, you can click Save and Test Now to trigger a round of tests right away.

Now let's navigate to the Synthetic > Benchmarks dashboard to check out how LEGO.com stacks up against the other sites.

At the top of the dashboard is a leaderboard with a filmstrip view of the rendering timelines for each benchmark site. Here you can see at a glance that the LEGO.com home page stacks up well against leading retailers like Amazon and Walmart. the page begins to visibly render at 1.5 seconds.

Further down the dashboard, we can compare historical data for specific rendering metrics, such as Largest Contentful Paint. Here you can see that the LCP time for the LEGO.com home page has been relatively fast and consistent over the previous 30 days. SpeedCurve retains 100% of your synthetic data for 13 months, so you can do year-over-year comparisons.

From any point in the time series chart, you can drill down and get detailed test results for any of the pages you're testing.
You can also generate awesome video versions of your filmstrip view, showing your page rendering side-by-side with your competitors. These videos can be a very effective way of demonstrating performance successes (or of demonstrating why you need to invest in performance optimization).
Updated 14 days ago